2023
Key figures
Profit after tax
5,153 NOK million
Greenhouse gas emissions
546,859 tCO₂e
Sorting rate
91 %
Hydropower production
18.5 TWh
Number of employees
812
Number of injuries
7.4 per million hours worked
FINANCIAL KEY FIGURES
| NOK million | 2023 | 2022 |
|---|---|---|
| Revenues and other income | 18,698 | 22,028 |
| EBITDA | 15,130 | 20,087 |
| Operating profit (EBIT) | 13,862 | 19,340 |
| Underlying operating profit | 12,492 | 19,914 |
| Profit before tax | 13,631 | 18,879 |
| Profit after tax | 5,153 | 4,344 |
| Net interest-bearing debt | 9,608 | 9,523 |
| -of which subordinated debt | 5,421 | 7,338 |
| Total assets | 91,048 | 97,265 |
| Capital employed | 63,679 | 65,609 |
| Investments in operating assets | 1,217 | 870 |
| ROE (%)* | 11.0 % | 10.2 % |
| ROCE (%)* | 21.8 % | 29.5 % |
| Net interest-bearing debt/EBITDA (x)* | 0.6 | 0.5 |
| FFO/Net interest-bearing debt (%)* | 2 % | 155 % |
| Equity ratio (%) | 51 % | 44 % |
*We have changed the calculations of the key figures in the annual report to better reflect the Group’s financial situation by focusing exclusively on balance sheet values at the end of the period, in contrast to previously when we used average values. We believe this gives a more accurate and relevant indication of the Group’s performance and financial situation. The comparative figures have been changed accordingly.
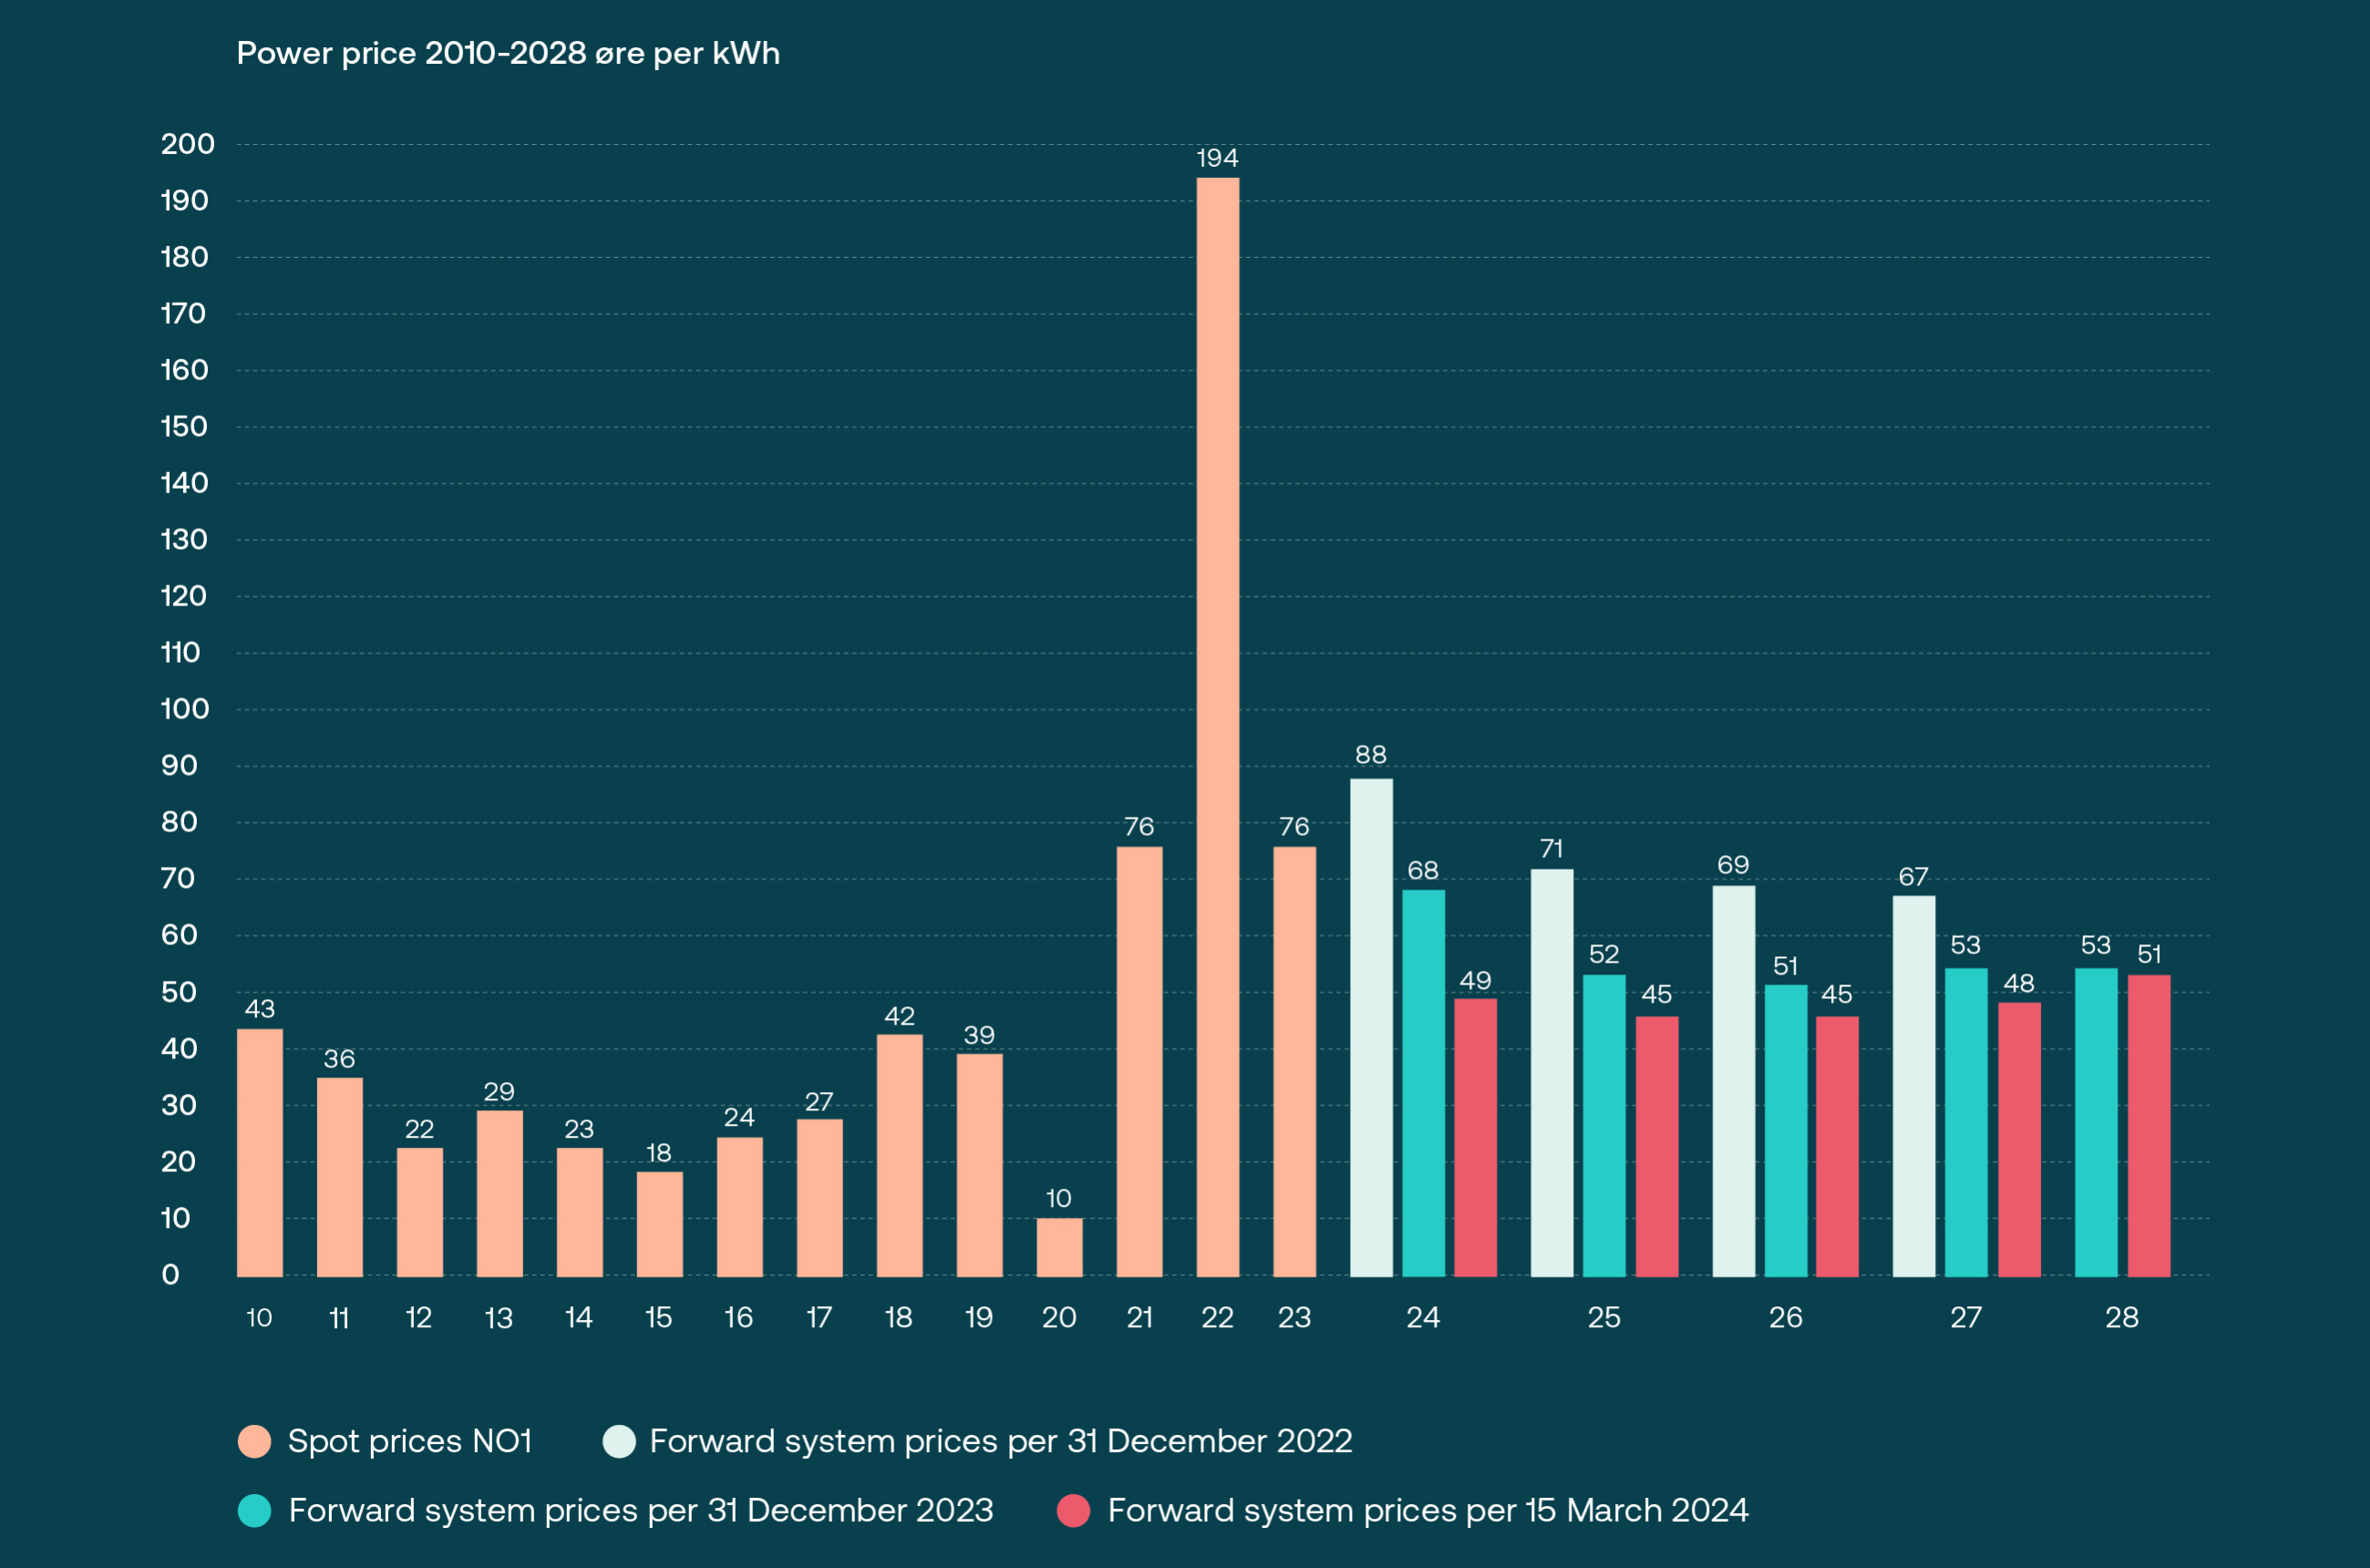
Power price 2010-2028

OTHER KEY FIGURES
| 2023 | 2022 | |
|---|---|---|
| Number of employees | 812 | 686 |
| Turnover (voluntary termination) | 3.4 % | 3.6 % |
| Number of injuries per million hours worked (H2) last 12 months | 7.4 | 2.9 |
| Greenhouse gas emissions (Scope 1, 2 and 3) (tCO2e) * | 546,859 | 410,274 |
| Hydropower produced (TWh) | 18.5 | 13.8 |
| Achieved power price (øre/kWh) | 73 | 150 |
| Nordic system price (øre/kWh) | 64 | 137 |
| Heat sales (GWh) | 1,833 | 761 |
*The carbon emissions include market-based emissions in scope 2. As a result of improved data quality and calculation methodology, the carbon emission figure for 2022 has been revised from the reported figure in 2022.


