Climate change
Business strategy, business model and core values
Hafslund is wholly-owned by the City of Oslo and this brings with it certain prerequisites that form the basis of the Group’s strategy. Among other things, the Group shall contribute to realising the City of Oslo’s climate strategy. This shall take place directly by reducing Hafslund’s own negative impact in the form of greenhouse gas emissions and indirectly in the form of taxes, duties to the state and local government and dividends to the owner.
At Hafslund, we work “For a world in balance, with renewables”. The transition from energy production from fossil sources to energy production from renewable sources is not only one of the biggest challenges facing society, but also the most important single solution to climate challenges. Hafslund’s core business, i.e. renewable energy production, will become even more important in the years to come and means that, as a group, Hafslund is well-equipped for the transition that society will need to undergo to slow down and ultimately stop the emission of greenhouse gases into the atmosphere.
Hafslund’s strategy is based on five strategic focus areas to be solved and goals to be achieved by 2035, four of which are closely linked to climate change:
- Contribute to being climate and nature-positive
- Contribute to strong growth in renewable energy
- Contribute to achieving balance for the energy system of the future
- Engage in smart and green urban development
This means that Hafslund cannot continue to operate as the Group has traditionally done, and must adapt to climate change by:
- Reducing negative impact by minimize the Group’s greenhouse gas emissions.
- Adapting operations and management to climate change (climate adaptation). Among other things, this involves protecting our own facilities and local communities against the effects of extreme weather and flooding.
- Developing new and existing services that make a positive contribution towards slowing climate change and reducing the need for fossil fuels. In the coming years, Hafslund plans to develop more renewable energy and make existing power plants more efficient.
Transitional plan for climate-positivity
In autumn 2023, Hafslund began formalising the transitional plan for net zero greenhouse gas emissions and affirming the Group’s contributions towards limiting global warming in line with the Paris Agreement. The content of the plan has long been a work in progress. The transitional plan further specifies and systemises this work. Guidelines are rooted in the Group sustainability policy and Hafslund has had metrics and targets for reducing greenhouse gas emissions since 2019. Both policies and targets are firmly established with Group management. Hafslund is working on measures to reduce the Group’s emissions. The most important measures are described under Actions.
Hafslund is ambitious in its climate change work and the goal is to become climate-positive by 2030. To achieve this, the Group is completely dependent on reducing its direct and indirect emissions as much as possible. One of the most important measures for reducing Hafslund’s emissions is the company’s carbon capture and storage project currently in progress at the Klemetsrud waste incineration plant in Oslo. In addition, Hafslund must impose requirements on procurements and the company needs to adapt when concerning the development of new power plants.
The carbon capture plant at Klemetsrud will produce negative emissions, i.e. CO2 will be removed from natural circulation. About 50 per cent of the waste treated at the Klemetsrud waste incineration plant originates from biogenic substances. This includes paper, cardboard, wood suitable for recycling and leftover food not sorted as food waste. This means that when the CO2 in this waste is captured and stored, CO2 is removed from the atmosphere. This is also known as Bio-CCS or BECCS, something the European Commission, the United Nations and the International Energy Agency highlight as being of vital importance to achieving the world’s climate goals. Model scenarios show that to limit global warming to 1.5°C or 2°C, Hafslund is reliant on large amounts of “negative emissions” being achieved by removing CO2 from the atmosphere.
Hafslund is ambitious in its climate change work and the goal is to become climate-positive by 2030.
Impact, risks and opportunities
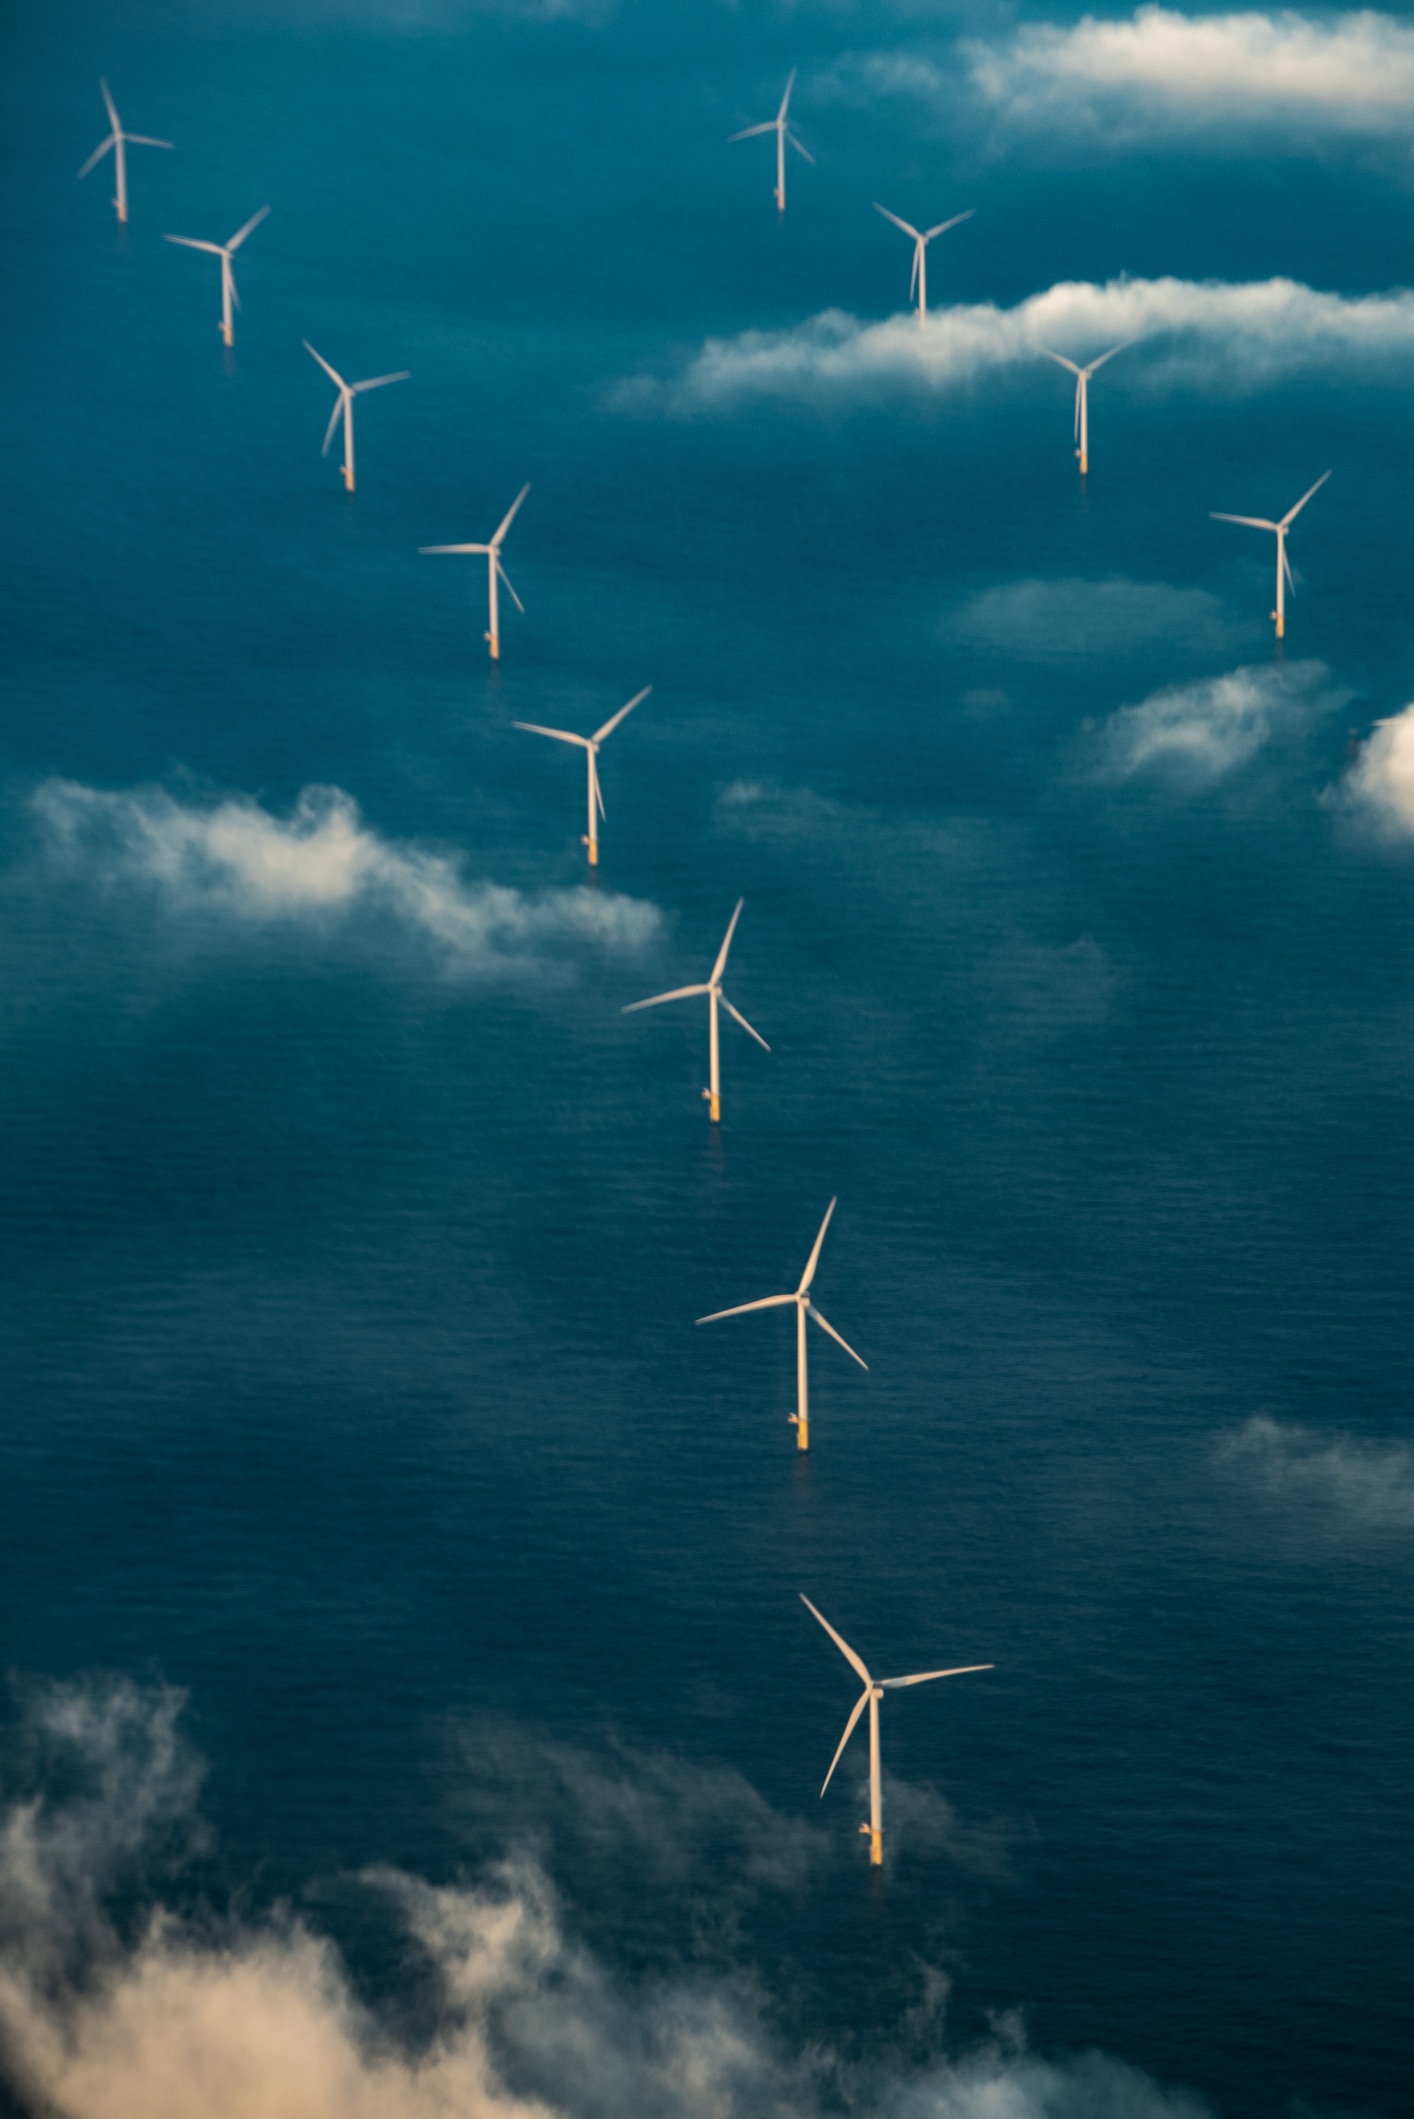
Hafslund has a positive and negative impact on the climate. The world is facing a huge challenge in coping with the transition to a zero-emission society and Hafslund’s most important climate contribution is the production of renewable energy. Hydropower, solar and wind energy are means of clean energy production that have low emissions when compared to the average greenhouse gas emissions from European power production. In the heating and cooling operations, local excess energy, which would otherwise have been lost, is used to produce hydronic district heating and district cooling.
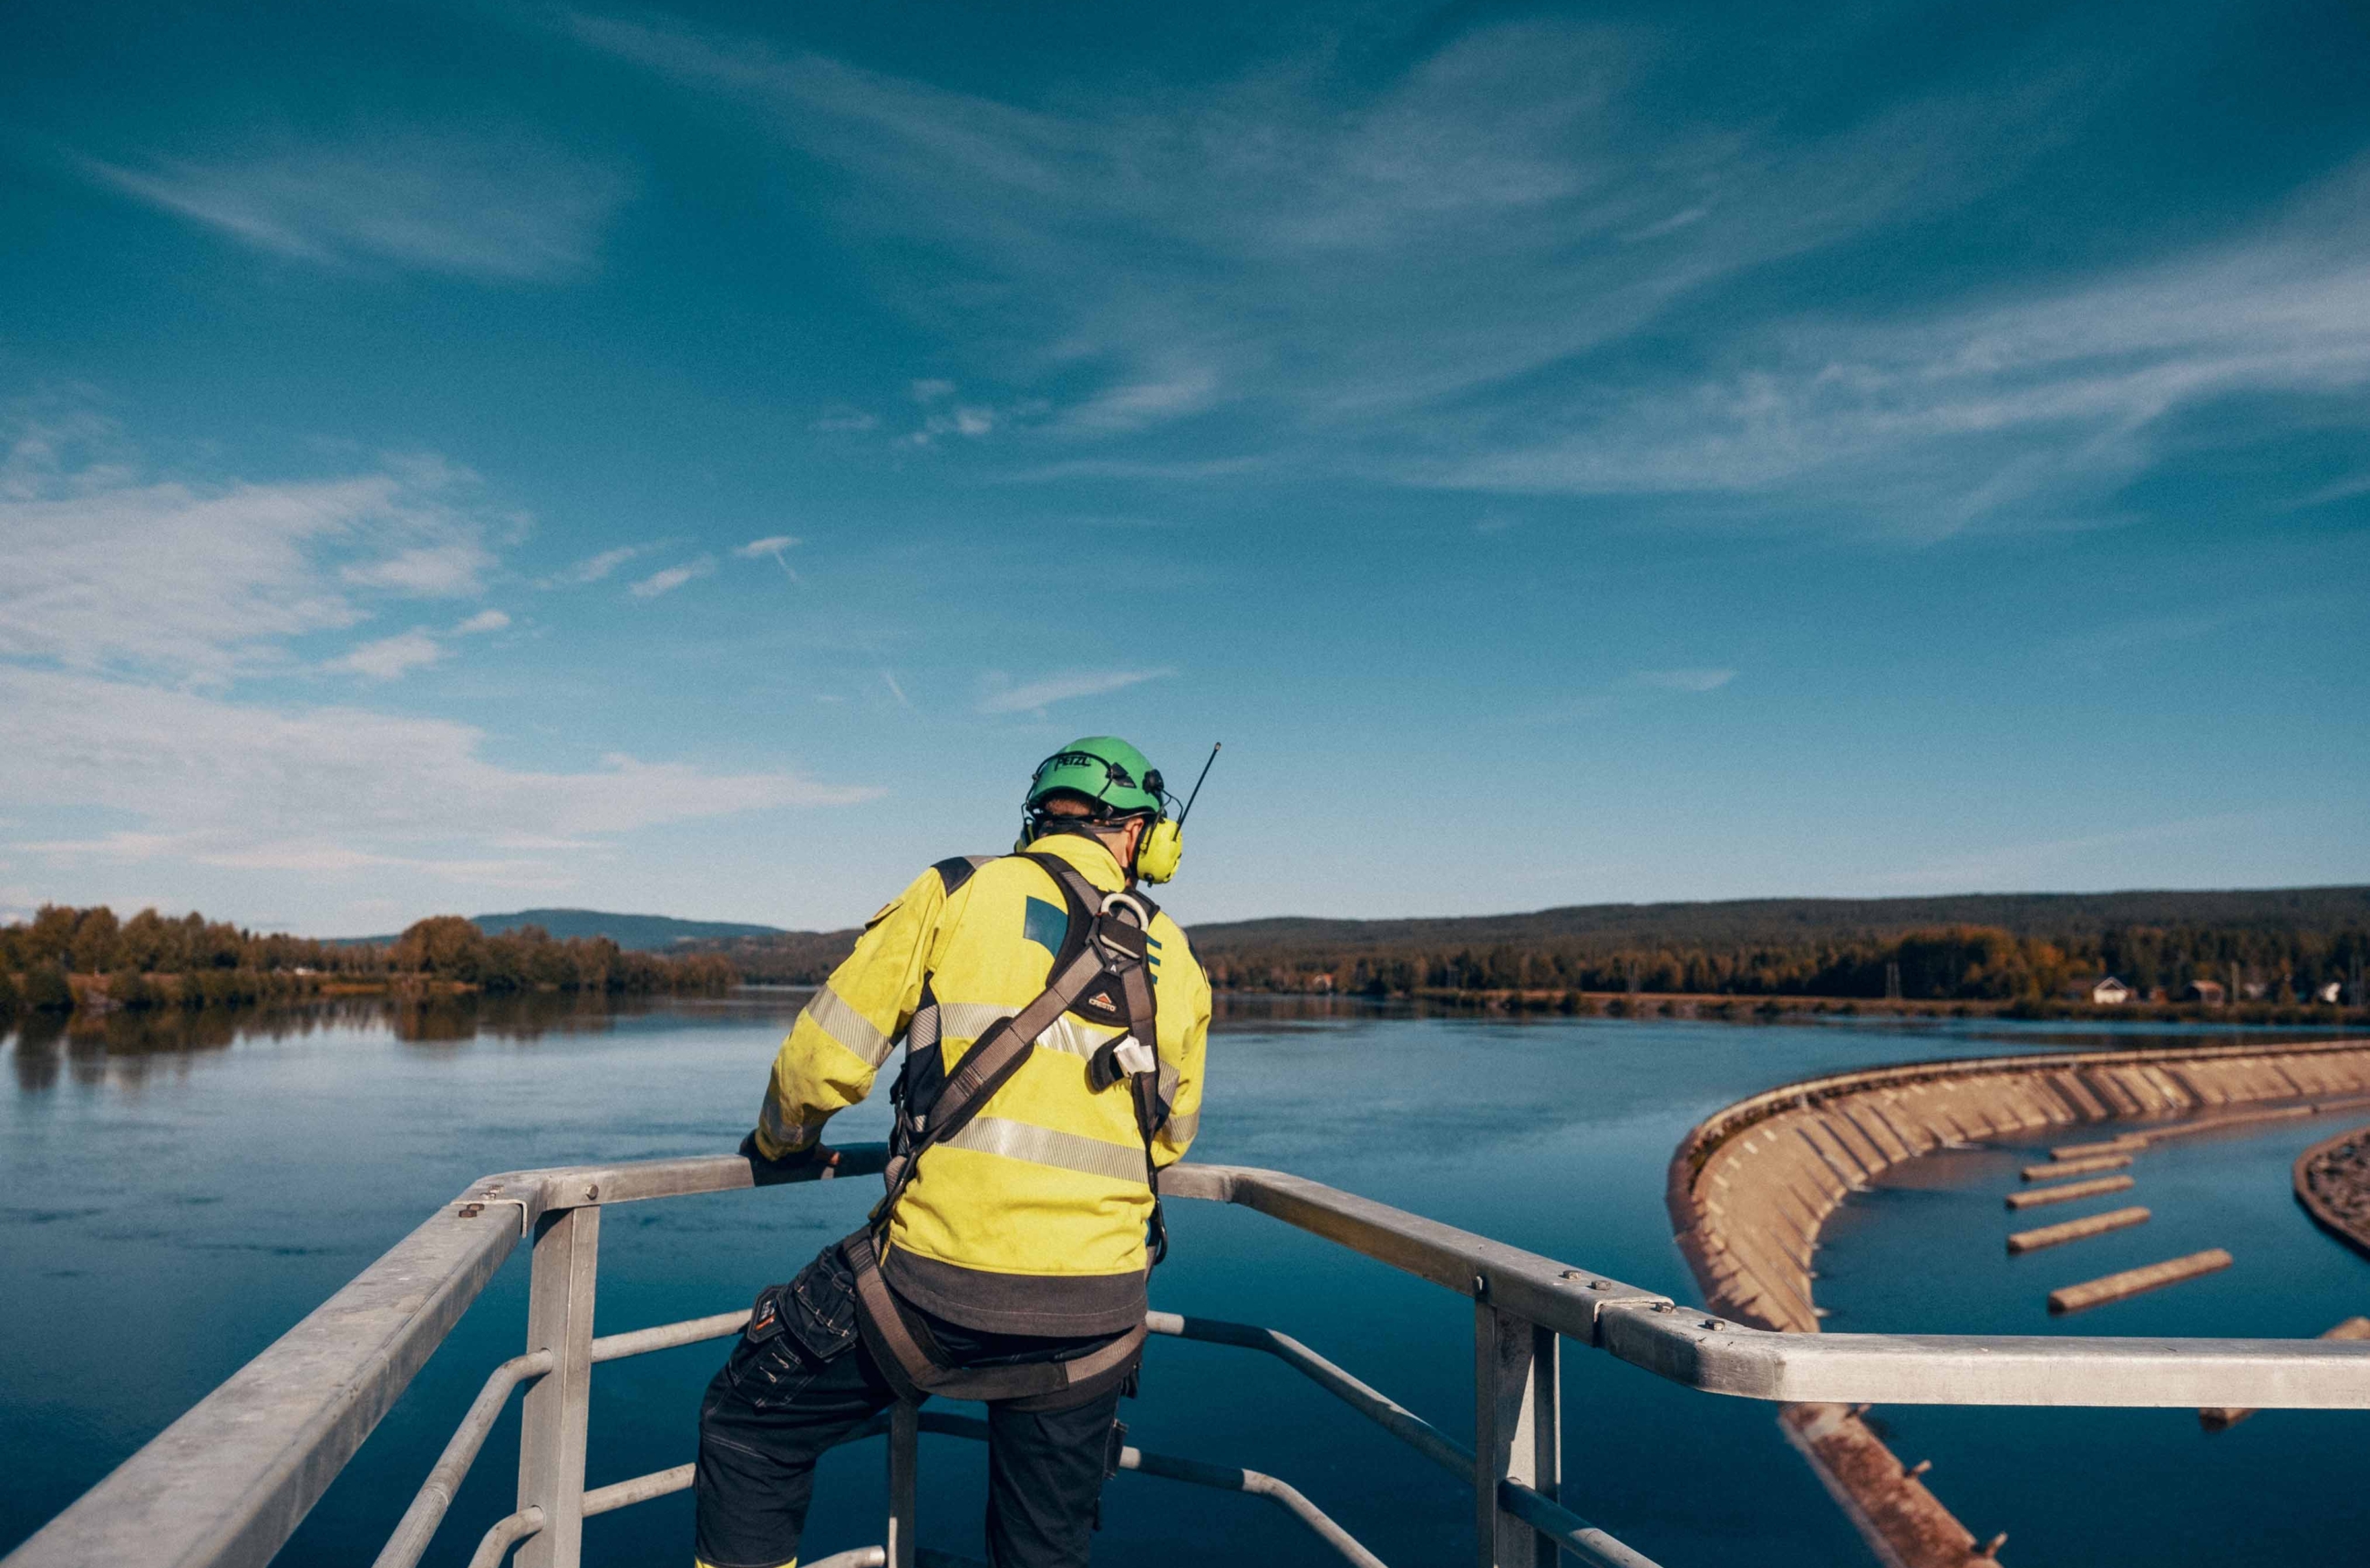
Hydropower plants contribute to the protection of the environment and act as a climate adaptation measure. The reservoirs help reduce the risk of flooding in the watercourses and the associated damage. Hafslund actively uses the reservoirs to mitigate flooding by reducing and levelling out flooding during periods with heavy precipitation and inflow. There is a close and regular dialogue with the Norwegian Water Resources and Energy Directorate, regulatory associations, public authorities and affected parties in the event of flood alleviation and flood situations.
Hafslund’s biggest negative impact on climate change is greenhouse gas emissions. The Group’s largest direct emissions (Scope 1) are from the waste incineration plants belonging to the district heating business. Incineration is the only legal means of treating waste in Norway and if the waste had become landfill, the greenhouse gas emissions would have been about 75 per cent higher than what is emitted from the incineration plants. Excess heat from the incineration process is used to produce heating. However, the greenhouse gas emissions are still significant, and the incineration plant at Klemetsrud is both Hafslund and the City of Oslo’s largest source of point emissions of greenhouse gases. The highest indirect emissions (Scope 3) relate to Hafslund’s development projects for new renewable energy and input factors/fuels for the district heating plants, as well as Hafslund’s investments in other companies.
In 2023, Hafslund conducted a climate risk analysis in line with the TCFD framework. Two scenarios were used in the analysis:
- “Climate chaos”: Involves climate policy that is not very ambitious or is non-existent, and serious physical climate change – both acute and chronic. This scenario is based on the United Nations Intergovernmental Panel on Climate Change’s climate scenario, with little to no change.
- “Low carbon revolution”: Is a combination of the United Nations Intergovernmental Panel on Climate Change’s two scenarios for rapid transition and slow transition. Several reports show that society is moving towards global warming of over 1.5°C and Hafslund therefore takes the physical climate consequences of this into account in the low-carbon scenario. Slow transition is used as a basis for physical risk and rapid transition is used as the basis for transitional risk and climate-related opportunities.
The table below summarises the Group’s most significant risks and opportunities related to “Climate change”:
| Risks | Opportunities | ||
|---|---|---|---|
| • Physical risk | Balance for the energy system of the future | ||
| • Greater unpredictability for production and planning due to change in weather patterns | New markets and change in customer needs due to climate change | ||
| • Changes in markets due to changes in weather and climate | Opportunities and price variations in the energy system of the future | ||
| • Increased risk of damage and collapse of infrastructure due to increased frequency of extreme weather | Increased hydropower production due to climate change | ||
| o Transitional risk | Access to green capital | ||
| o Uncertainty in price/demand related to raw materials and input factors | Competitive advantage and new business opportunities when transitioning to the low-emission society | ||
| o Failed investments in technology | |||
| o Unpredictability and costs due to impending climate regulations | |||
| o Increased volatility in energy prices due to higher proportion of variable energy production |
How the financial effects of climate risk are taken into account is described in note 1.3 of the consolidated accounts.
Policy/Guidelines
Hafslund has a Group policy for sustainability which ensures that the Group has uniform sustainability principles.
The environment is one of many topics in Hafslund’s “Ethical guidelines and requirements for suppliers“. The guidelines apply to all of Hafslund’s suppliers and any subcontractors that may be used. Suppliers undertake to apply all rights and obligations set out in the guidelines in agreements with their subcontractors.

Principles directly related to climate:
- Hafslund shall have metrics and targets that are in line with the Paris Agreement.
- All companies shall continuously work to reduce Hafslund’s greenhouse gas emissions
- There shall be continual efforts to increase employee expertise relating to the Group’s environmental impact and ongoing measures.
Requirements that directly relate to the important topic:
- Hafslund’s suppliers shall have an effective system for minimising the negative environmental impact from their own operations, and prefer solutions that result in less energy and resource use and that reduce emissions.
- Environmental measures are assessed along the entire production and distribution chain – from the production of raw materials to sales. Negative environmental impact shall be reduced along the entire value chain. In line with the precautionary principle, measures shall be initiated to continuously minimise greenhouse gas emissions.
- Pollution of the atmosphere that has consequences for the climate is one of several important environmental challenges that suppliers are expected to counteract.
- Suppliers are expected to choose modern and efficient technologies that reduce greenhouse gas emissions.
Actions
Hafslund continuously works to reduce its negative impact, increase its positive impact, reduce risk and exploit opportunities associated with climate change. The measures with the greatest positive climate effect are described below. The measures have in common that they either reduce greenhouse gas emissions and/or that they contribute to increased production of renewable energy or a reduction in the need for fossil energy sources.

Metrics and targets
Hafslund has set ambitious metrics and targets related to reducing the Group’s greenhouse gas emissions:
| Metrics and targets | Result 2023 | Result 2022 | Comments |
|---|---|---|---|
| Become climate-positive by 2030 | 546,859 tCO₂e | 410,274 tCO₂e | Emissions include Scope 1, 2 and 3. Scope 2 includes market-based emissions figures. |
| 90 per cent reduction in Scope 1 and 2 by 2030* | 479,796 tCO₂e | 351,673 tCO₂e | 21 per cent increase in Scope 1 and 2 compared to 2019. Market-based Scope 2 has been used. For 2023, Hafslund Oslo Celsio did not purchase guarantees of origin for its own electricity consumption, which resulted in large Scope 2 emissions. |
| 50 per cent reduction in Scope 3 by 2030* | 67,063 tCO₂e | 58,601 tCO₂e | New method for calculating Scope 3 in 2023. Emissions in base year* (2019) have not yet been recalculated using the new method. |
| 100 per cent electric vehicle fleet by 2025 | 56 per cent | 33 per cent |
*Compared to base year (2019) where it was 395,138 tCo2e for scope 1+2.
The activities and associated emissions for Hafslund’s three business areas are very different. Therefore, separate metrics and targets have also been set for each company to support the Group’s overall metrics and targets, but which are also adapted in such a way that all subsidiaries have to reduce their greenhouse gas emissions.
Indicator table
Greenhouse gas accounts
| tCO₂e | 2023 | 2022 |
|---|---|---|
| SCOPE 1 - DIRECT EMISSIONS | ||
| Power production | 799 | 1,053 |
| Total direct greenhouse gas emissions (scope 1) | 799 | 1,053 |
| SCOPE 2 - INDIRECT GREENHOUSE GAS EMISSIONS FROM PURCHASED ENERGY | ||
| Location-based | 473 | 234 |
| Market-based | 12 | 10 |
| SCOPE 3 - OTHER INDIRECT GREENHOUSE GAS EMISSIONS | ||
| 1. Purchased goods and services | 7,009 | 7,328 |
| 2. Capital goods | 8,284 | 7,490 |
| 3. Production of consumed fuel and energy | 190 | 171 |
| 4. Upstream transportation and distribution | 60 | 78 |
| 5. Waste generated in operations | 18 | 18 |
| 6. Business travel | 171 | 157 |
| 7. Employee commuting | - | - |
| 8. Upstream leased assets | 359 | 354 |
| 9. Downstream transportation and distribution | - | - |
| 10. Processing of sold products | - | - |
| 11. Use of sold products | - | - |
| 12. End-of-life treatment of sold products | - | - |
| 13. Downstream leased assets | - | - |
| 14. Franchises | - | - |
| 15. Investments | - | - |
| Total indirect greenhouse gas emissions (scope 3) | 16,091 | 15,596 |
| Total greenhouse gas emissions, location-based | 17,363 | 16,883 |
| Total greenhouse gas emissions, market-based | 16,902 | 16,659 |
Explanation for recalculated 2022 value: Improved data quality and calculation methodology for Hafslund’s indirect emissions (scope 3)
| tCO₂e | 2023 | 2022 |
|---|---|---|
| SCOPE 1 - DIRECT EMISSIONS | ||
| Waste incineration* | 202,397 | 197,777 |
| District heating | 6,961 | 5,859 |
| Total direct greenhouse gas emissions (scope 1) | 209,358 | 203,636 |
| SCOPE 2 - INDIRECT GREENHOUSE GAS EMISSIONS FROM PURCHASED ENERGY | ||
| Location-based | 10,205 | 3,992 |
| Market-based | 269,627 | 146,974 |
| SCOPE 3 - OTHER INDIRECT GREENHOUSE GAS EMISSIONS | ||
| 1. Purchased goods and services | 6,138 | 5,411 |
| 2. Capital goods | 74 | 1,485 |
| 3. Production of consumed fuel and energy | 4,322 | 4,322 |
| 4. Upstream transportation and distribution | 18 | - |
| 5. Waste generated in operations | - | - |
| 6. Business travel | - | - |
| 7. Employee commuting | - | - |
| 8. Upstream leased assets | - | - |
| 9. Downstream transportation and distribution | - | - |
| 10. Processing of sold products | - | - |
| 11. Use of sold products | - | - |
| 12. End-of-life treatment of sold products | - | - |
| 13. Downstream leased assets | - | - |
| 14. Franchises | - | - |
| 15. Investments | - | - |
| Total indirect greenhouse gas emissions (scope 3) | 10,552 | 11,218 |
| Total greenhouse gas emissions, location-based | 230,115 | 218,846 |
| Total greenhouse gas emissions, market-based | 489,537 | 361,828 |
| *Biogenic emissions | 190,072 | 188,551 |
Explanation for recalculated 2022 value: Improved data quality and calculation methodology for Hafslund’s indirect emissions (scope 3)
| tCO₂e | 2023 | 2022 |
|---|---|---|
| SCOPE 1 - DIRECT EMISSIONS | ||
| Total direct greenhouse gas emissions (scope 1) | - | - |
| SCOPE 2 - INDIRECT GREENHOUSE GAS EMISSIONS FROM PURCHASED ENERGY | ||
| Location-based | 2 | - |
| Market-based | - | - |
| SCOPE 3 - OTHER INDIRECT GREENHOUSE GAS EMISSIONS | ||
| 1. Purchased goods and services | 463 | 172 |
| 2. Capital goods | 315 | - |
| 3. Production of consumed fuel and energy | - | - |
| 4. Upstream transportation and distribution | 1 | - |
| 5. Waste generated in operations | - | - |
| 6. Business travel | 7 | - |
| 7. Employee commuting | - | - |
| 8. Upstream leased assets | 3 | - |
| 9. Downstream transportation and distribution | - | - |
| 10. Processing of sold products | - | - |
| 11. Use of sold products | - | - |
| 12. End-of-life treatment of sold products | - | - |
| 13. Downstream leased assets | - | - |
| 14. Franchises | - | - |
| 15. Investments | 38,879 | 30,769 |
| Total indirect greenhouse gas emissions (scope 3) | 39,667 | 30,941 |
| Total greenhouse gas emissions, location-based | 39,669 | 30,941 |
| Total greenhouse gas emissions, market-based | 39,667 | 30,941 |
Explanation for recalculated 2022 value: Improved data quality and calculation methodology for Hafslund’s indirect emissions (scope 3)
| tCO₂e | 2023 | 2022 |
|---|---|---|
| SCOPE 1 - DIRECT EMISSIONS | ||
| Total direct greenhouse gas emissions (scope 1) | - | - |
| SCOPE 2 - INDIRECT GREENHOUSE GAS EMISSIONS FROM PURCHASED ENERGY | ||
| Location-based | 136 | 323 |
| Market-based | - | - |
| SCOPE 3 - OTHER INDIRECT GREENHOUSE GAS EMISSIONS | ||
| 1. Purchased goods and services | 727 | 811 |
| 2. Capital goods | - | 1 |
| 3. Production of consumed fuel and energy | 13 | 31 |
| 4. Upstream transportation and distribution | 1 | 1 |
| 5. Waste generated in operations | - | - |
| 6. Business travel | 12 | 1 |
| 7. Employee commuting | - | - |
| 8. Upstream leased assets | 1 | 1 |
| 9. Downstream transportation and distribution | - | - |
| 10. Processing of sold products | - | - |
| 11. Use of sold products | - | - |
| 12. End-of-life treatment of sold products | - | - |
| 13. Downstream leased assets | - | - |
| 14. Franchises | - | - |
| 15. Investments | - | - |
| Total indirect greenhouse gas emissions (scope 3) | 754 | 846 |
| Total greenhouse gas emissions, location-based | 890 | 1,169 |
| Total greenhouse gas emissions, market-based | 754 | 846 |
Explanation for recalculated 2022 value: Improved data quality and calculation methodology for Hafslund’s indirect emissions (scope 3)
| tCO₂e | 2023 | 2022 |
|---|---|---|
| SCOPE 1 - DIRECT EMISSIONS | ||
| Power production | 799 | 1,053 |
| Waste incineration* | 202,397 | 197,777 |
| District heating | 6,961 | 5,859 |
| Total direct greenhouse gas emissions (scope 1) | 210,157 | 204,689 |
| SCOPE 2 - INDIRECT GREENHOUSE GAS EMISSIONS FROM PURCHASED ENERGY | ||
| Location-based | 10,816 | 4,549 |
| Market-based | 269,639 | 146,984 |
| SCOPE 3 - OTHER INDIRECT GREENHOUSE GAS EMISSIONS | ||
| 1. Purchased goods and services | 14,337 | 13,722 |
| 2. Capital goods | 8,673 | 8,976 |
| 3. Production of consumed fuel and energy | 4,525 | 4,524 |
| 4. Upstream transportation and distribution | 79 | 79 |
| 5. Waste generated in operations | 18 | 18 |
| 6. Business travel | 190 | 158 |
| 7. Employee commuting | - | - |
| 8. Upstream leased assets | 362 | 355 |
| 9. Downstream transportation and distribution | - | - |
| 10. Processing of sold products | - | - |
| 11. Use of sold products | - | - |
| 12. End-of-life treatment of sold products | - | - |
| 13. Downstream leased assets | - | - |
| 14. Franchises | - | - |
| 15. Investments | 38,879 | 30,769 |
| Total indirect greenhouse gas emissions (scope 3) | 67,063 | 58,601 |
| Total greenhouse gas emissions, location-based | 288,036 | 267,840 |
| Total greenhouse gas emissions, market-based | 546,859 | 410,274 |
| *Biogenic emissions | 190,072 | 188,551 |
Explanation for recalculated 2022 value: Improved data quality and calculation methodology for Hafslund’s indirect emissions (scope 3)
Emission intensity
| Emission intensity | Unit | 2023 | 2022 | Comment |
|---|---|---|---|---|
| CO2 intensity district heating | gCO2e/kWh | 23 | 16 | Calculated based on methodology in accordance with the EPD regulations |
| Total greenhouse gas emissions (location-based) per net income | tCO2e/Kr | 16.6 | 10.5 | The value is calculated from the sum of greenhouse gas emissions calculated using the location-based method and consolidated sales revenue from the Group's total comprehensive income |
| Total greenhouse gas emissions (market-based) per net income | tCO2e/Kr | 31.5 | 16.1 | The value is calculated from the sum of greenhouse gas emissions calculated using the market-based method and consolidated sales revenue from the Group's total comprehensive income |
Energy consumption and energy mix
| Energy consumption and energy mix | Unit | 2023 | 2022 | Comment |
|---|---|---|---|---|
| Energy consumption | ||||
| Electricity consumption | GWh | 25.5 | 22.6 | |
| Total energy consumption Celsio | GWh | 2,102.6 | 1,919.9 | |
| Energy mix and production of renewable energy | ||||
| Power production* | GWh | 18,460 | 13,800 | Hafslund Eco Vannkraft's share of production in all power plants |
| Share of renewable power production | Per cent | 100 | 100 | |
| Production of Guarantees of Origin* | GWh | 18,320 | 13,200 | |
| Production of electricity certificates* | GWh | 970 | 780 | |
| Power losses as a result of regulatory revisions | GWh | 5.6 | 14.7 | Regulatory revision Uste and Hallingdal watercourses |
| Energy mix and production of district heating | ||||
| Production of district heating | GWh | 1,997 | 1,807 | Produced energy for PV grid (supplied to heat exchanger in heating plant) |
| Share of renewable district heating | Per cent | 48 | 43 | District heating produced using renewable energy |
| Share of carbon-neutral district heating | Per cent | 51 | 55 | District heating produced using waste heat |
| Investments in renewable energy | ||||
| Increased installed capacity - power production | MW | - | 10 | |
| Increased installed capacity - district heating | MW | 1.5 | 50 | New heat pump in facilities operated by Hafslund Oslo Celsio |
| Reinvestment in production facilities | GWh | 23 | 13 | |
| Investment in new production | GWh | - | 43 | |
| Renewable energy projects in planning phase | GWh | 650 | 700 | Estimate for Hemsil 3, Sarp 2, FKF 5, Frosen, Låvi, Aurland 2 HF 2, Nes, Grotli, Skjefstadfoss 3 and Bjørkum |
| Electric vehicles | ||||
| Share of electric passenger cars in the fleet | Per cent | 56 | 33 |
*Rounded to the nearest 10 GWh